 Test drive Rachota 2.4 now!
You will be asked to confirm one security warning dialog.
This article is translated to
 Russian language by Michael Popov from Bizow.com.
This article is translated to
 Polish language by Alice Slaba.
This article is translated to
 Vietnamese by Julia Duong from Coupofy team.
This article is translated to
 Dutch by Anna from bespaardeals.
This article is translated to
 Greek by Dimitris Galatas from More Sky.
This article is translated to
 Ukrainian by Sergey Cosbuk from TheWordPoint team.
This article is translated to
 Georgian by Diane Sherron from GrabMyEssay team.
 1. Plan your work
If your work at computer contains regular tasks that repeat on a daily/weekly basis, register them in the
Settings dialog before going on.
Every task you want to measure must exist in your day plan. In order to do that click the
 Add ... button. The
Task settings dialog shows up. Enter suitable description of your new task and set its priority.
If necessary, setup other task properties too.
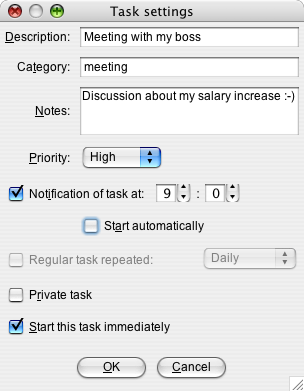
An example of a high priority task with time notification.
 2. Work your plan
If you want to start working on a task, highlight it and click the
 Select button. This will set the task as current. Once you click the
 Work
button, Rachota will start measuring time you spent on this task. The same can be achieved by double clicking
the task item itself.
If you need a break, click the  Relax button to temporarily suspend measuring the time. When you finish
a task, click the
  Done button.
You will need to let Rachota know when you switch between tasks or you are
leaving the computer. Rachota will continue to measure time until you tell it to stop or switch tasks.
Day view is obviously the most used part of Rachota.
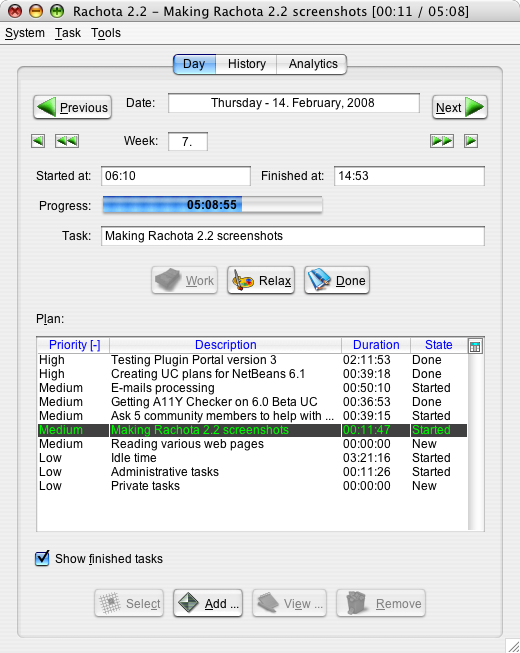
Main Rachota window showing planned tasks at the end of a day.
 3. Analyse your time data
Most likely you will want to use Rachota to generate reports that display your time data. To do this, switch to
History tab and select the period of
time you are interested in.
If you are curious about either working hours or times when you worked in the past, switch to the
Times tab. Rachota provides three types of graphs and allows you to highlight
tasks based on certain criterion.
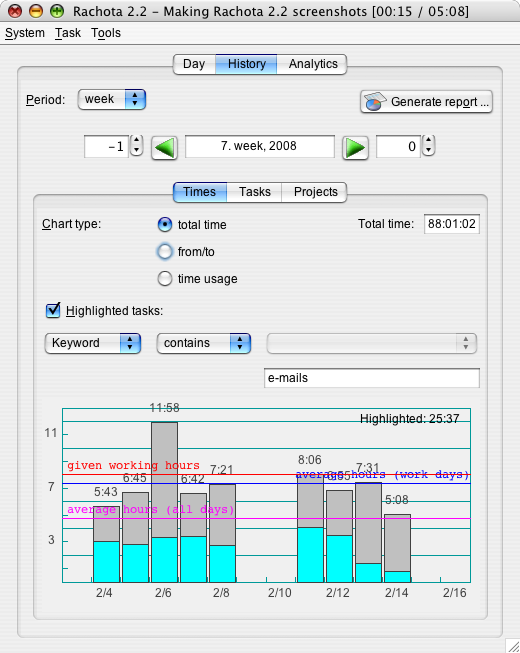
History view of two weeks data highlighting the time spent on e-mails.
If you need to know exactly what tasks you worked on during the selected period, switch to the
Tasks tab. If necessary, use the
 Add filter
button to narrow the set of tasks displayed in the table below.
If you need to generate a report or
invoice for your boss or customer, click the  Generate report ... button. In the Report generation wizard
you will be able to specify properties like format (TXT, CSV, HTML), file name, description, content and things like that.
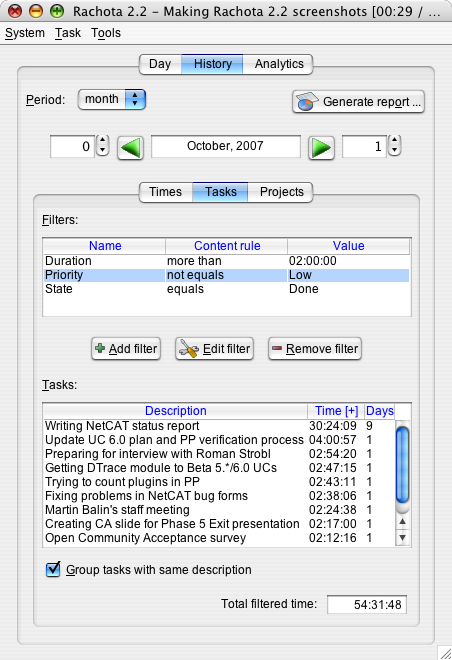
Search for important finished tasks in October and November lasting more than two hours.
In order to see a breakdown of tasks by projects, switch to the Projects tab. This is where you can inspect your projects in terms of their time share, tasks, state or priority.
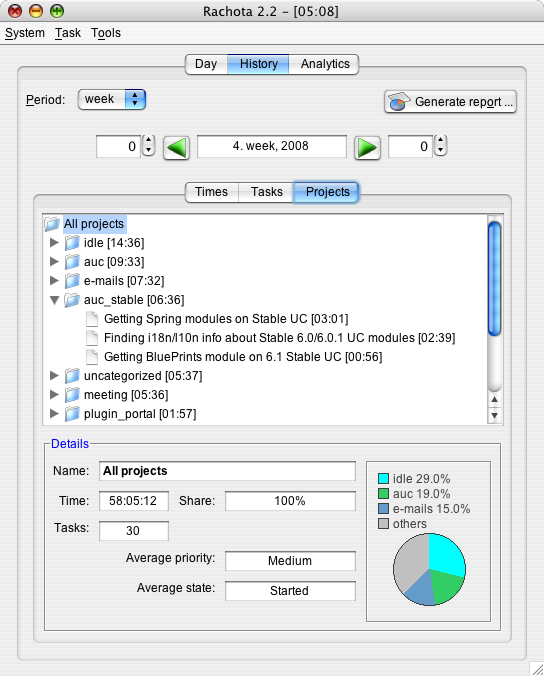
Breakdown of tasks by projects in 4th week of 2008.
Finally, Rachota can also analyze your data, compare them with other users and provide you with useful suggestions to better use your time in the future. To use this feature, switch to Analytics view.

Analytics view with comparison chart and suggestions.
 Easy 3-steps tutorial how to get started


